Prepare parcel boundaries from an AutoCAD drawing
Download the three-lot practice drawing (.dwg), or use a parcel drawing whose survey grid and units you can confirm. Open the drawing in Windows AutoCAD and save a working copy. You will identify the lot boundaries, export them to a GeoPackage and check one of the exported lots against the drawing.
The practice drawing contains three invented lots in WGS 84 / UTM zone 20N (EPSG:32620). One drawing unit equals one metre. You may copy, adapt and redistribute the sample.
If you already have a GeoPackage or want to practise importing without AutoCAD, use the downloadable example in Import a GeoPackage and check the result.
Use Windows desktop AutoCAD to run the converter, QGIS to check the exported polygons, and a LandWeave account with Editor access to open Bulk Upload and download the converter. See Tutorial access. This exercise produces local files. Importing the result is a separate exercise.
1. Identify the linework and confirm its grid
In your working copy, open Model space, set UCS to World and use ZOOM → Extents. Zoom to a labelled lot. Select a side, then its lot-number text, and read their layer names in Properties. Follow the sides around the label. Distinguish the lines that enclose the lot from area text, dimensions and road annotations.
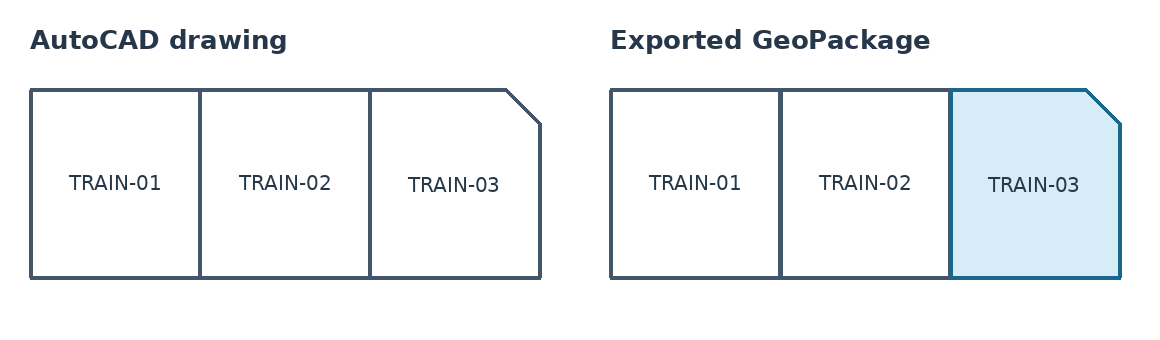
In the practice drawing, find TRAIN-03, the rightmost lot. Its short diagonal side at the northeast corner will help you recognise it after export. If you are using your own drawing, choose a lot with a distinctive shape and confirm the grid and units against the survey record before continuing.
2. Review the candidate boundaries
In LandWeave, open Bulk Upload and choose Download AutoCAD converter. Drag your downloaded script onto the drawing in AutoCAD. Keep this personalised file private. The LOTREVIEW dialog opens.
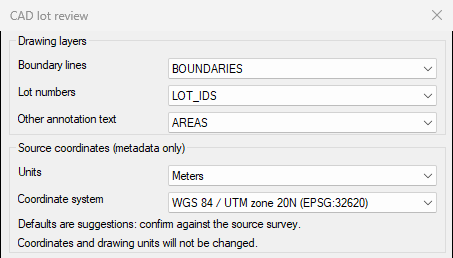
For the practice drawing, choose BOUNDARIES for Boundary lines, LOT_IDS for Lot numbers and AREAS for Other annotation text. Select Meters and WGS 84 / UTM zone 20N (EPSG:32620). For your own drawing, use the layer names, units and grid you identified in step 1. The converter offers WGS 84 / UTM zone 20N and the St. Kitts 2001 Grid. If your drawing uses another grid, use the supplied drawing for this exercise. Choose a new review CSV filename and select Extract candidates.
Inspect the review markers against the original linework. For each lot you intend to export, check for one enclosing boundary, one intended label and a continuous outline around the same lot. An orange boundary or a red label marker needs investigation. If a trace crosses a road or collects two lots, correct the linework in the working copy and rerun the review. With the synthetic drawing you should see 3 green candidates, 0 orange boundaries and 0 flagged label locations. Save the reviewed copy.
3. Export only the reviewed lots
For the synthetic drawing, run LOTEXPORT with nothing selected. Check that Boundary export layer is the green candidate layer you just reviewed. This exports all three lots. To export a subset in your own drawing, preselect just the reviewed boundary polylines you need before running LOTEXPORT.
Check the lot-number and annotation layers again. Confirm the units and CRS, tick I reviewed these lots and confirmed their units and CRS, and choose a fresh geometry CSV filename. Select Export metre geometry, then choose a fresh GeoPackage destination. Keep both files. The earlier review CSV contains the findings; the export CSV contains the polygon coordinates.
4. Compare a lot with the drawing
Open the new GeoPackage in QGIS. In Layer Properties → Information, check that parcels contains polygons in the installation’s parcel CRS, with units in metres. Check the feature count against the number you exported. In the attribute table, find the original lot number and check its parcel ID. Zoom to it and identify the same lot in AutoCAD.
In the synthetic sample, look for TRAIN-03. Its northeast corner is cut diagonally. Its five-sided boundary encloses 432 m². The other two lots are rectangles of 440 m² each.
Compare the two views below at the same scale. Start at the shared side between TRAIN-02 and TRAIN-03 and follow TRAIN-03 clockwise. The diagonal should meet the same two sides in both views.
Choose a second lot and match its identifier and shape between the two files. Record the lot number, the confirmed drawing units and the output CRS. Continue with Import a GeoPackage and check the result, using your exported file in an empty practice dataset.